Data Insights
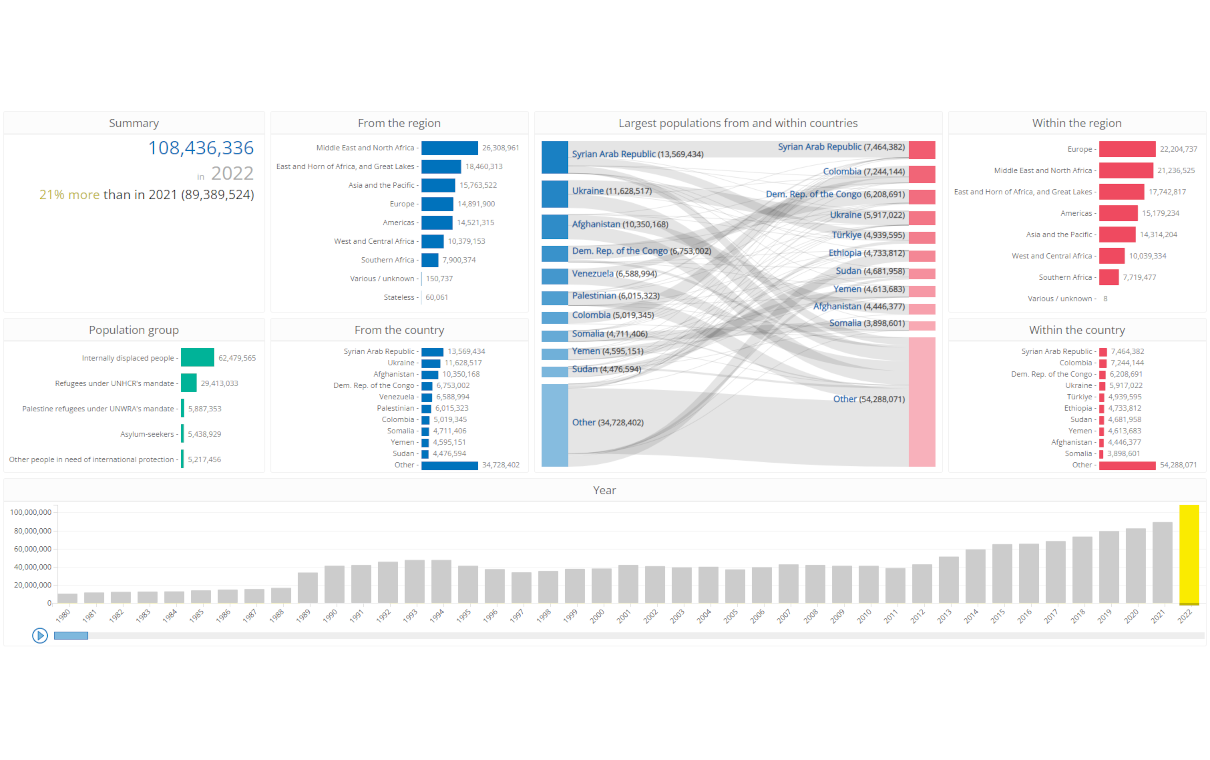
The following collection of stories and visualisations explain and summarise the data in the refugee data finder.
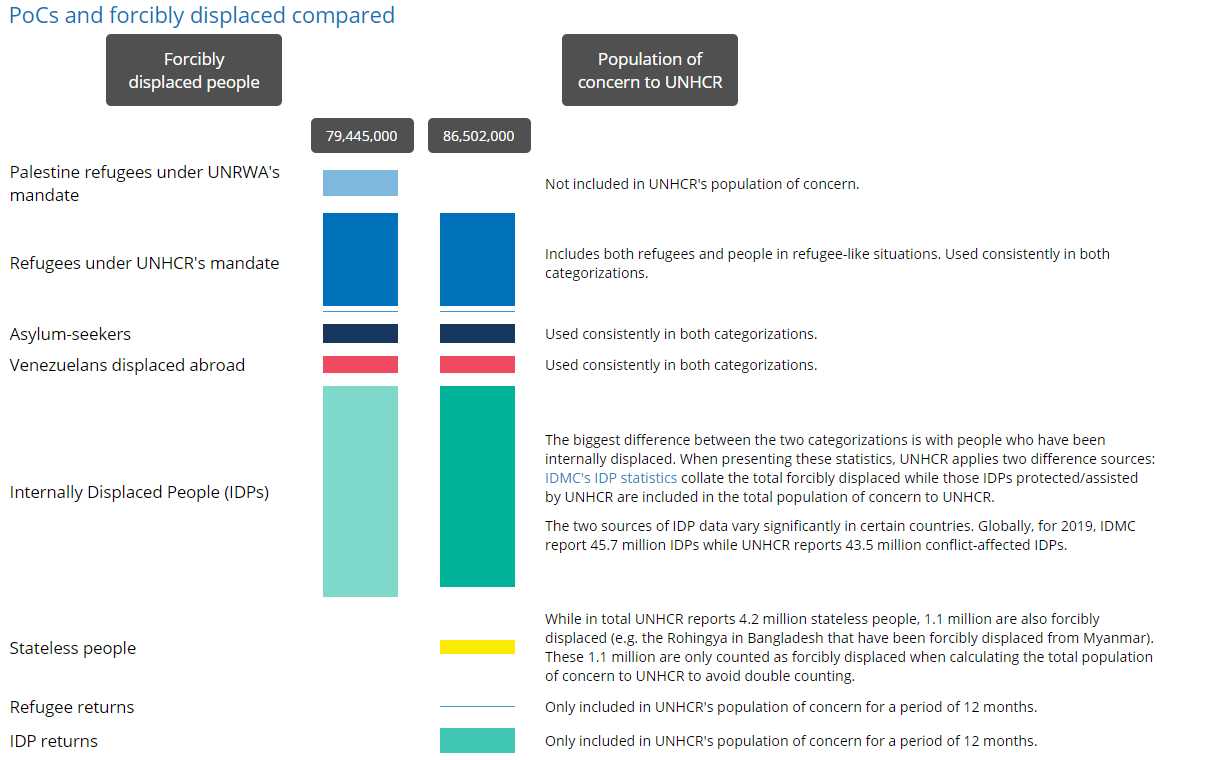
Compares the categorisation of forcibly displaced people with the population UNHCR protects and/or assists.
Nowcasting estimates produced for the previous month on a rolling basis.
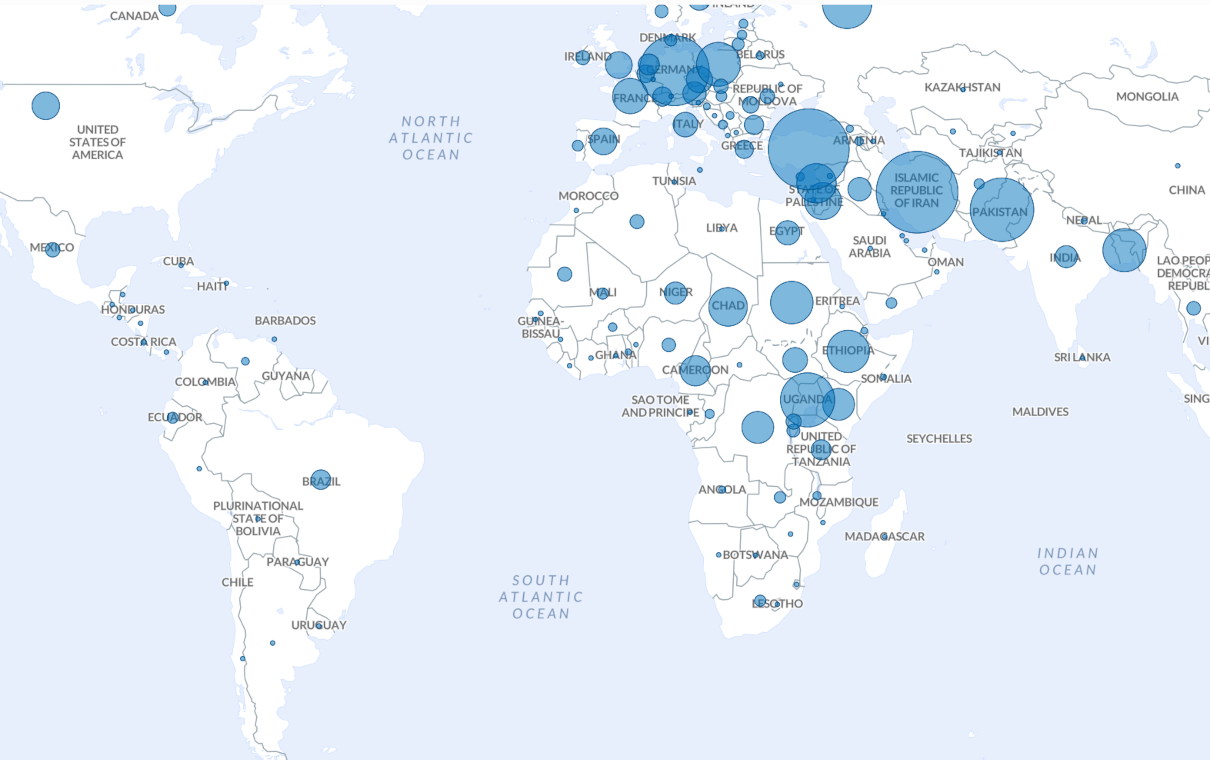
Interactive maps showing the number of people in each population groups that UNHCR protects and/or assists.
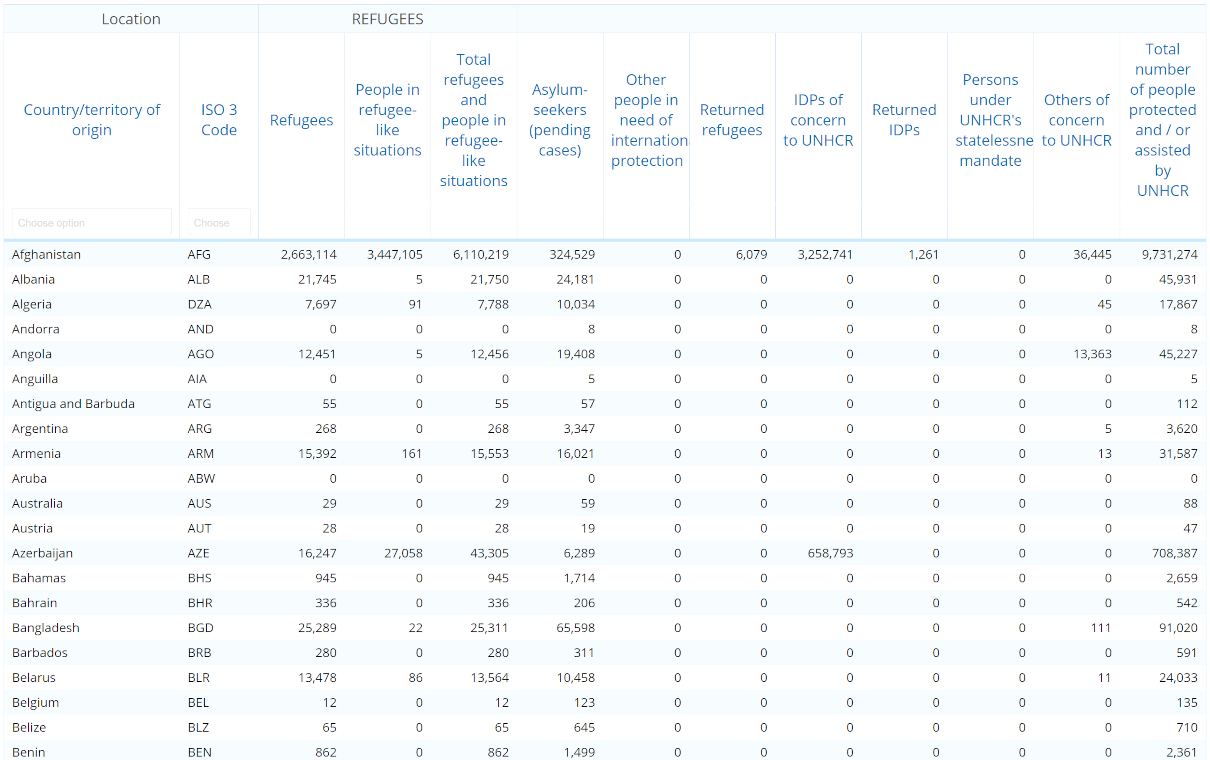
Annexes showing the number of people in each population group that UNHCR protects and/or assists.
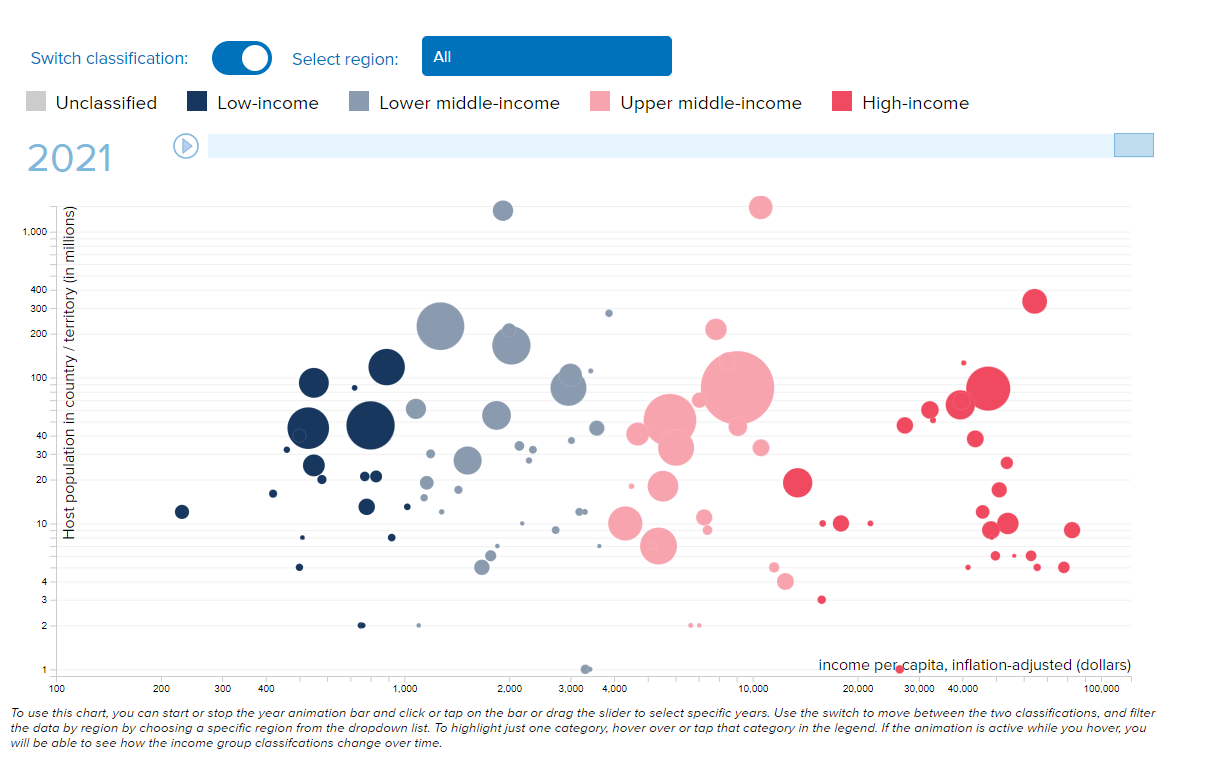
Three facts about refugee host countries have remained relatively consistent over time.
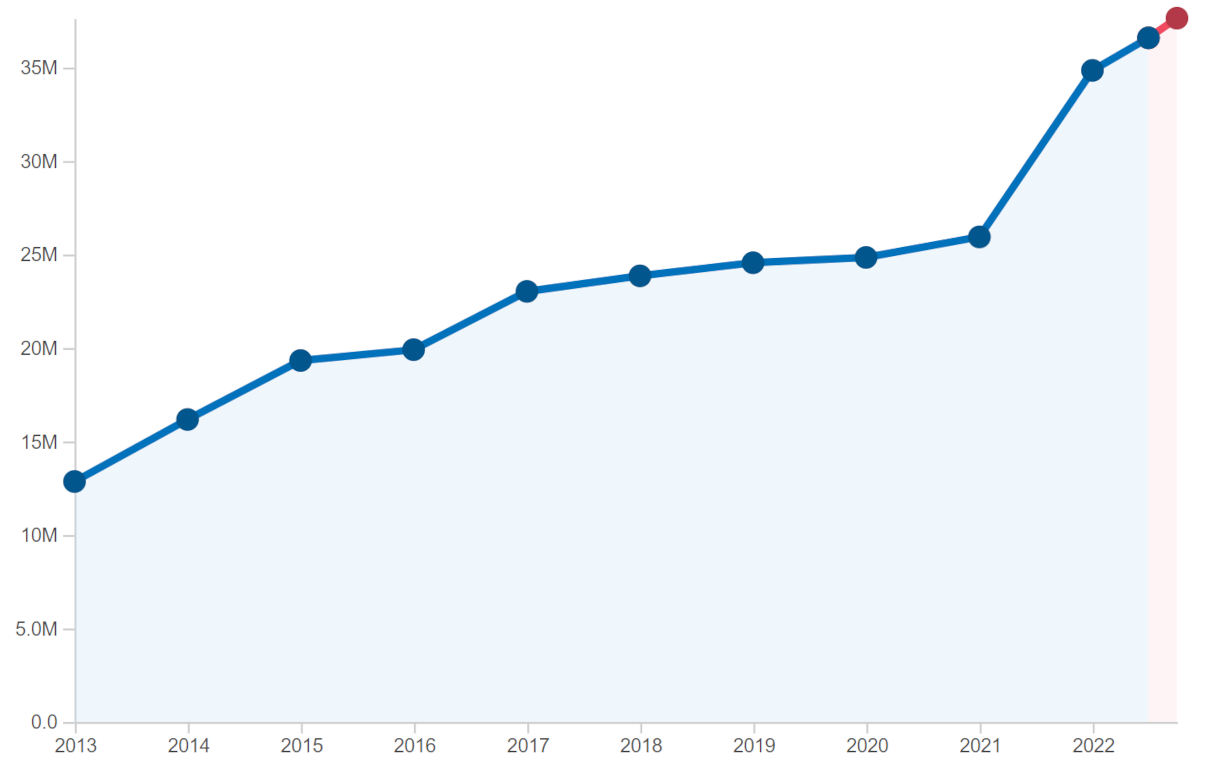
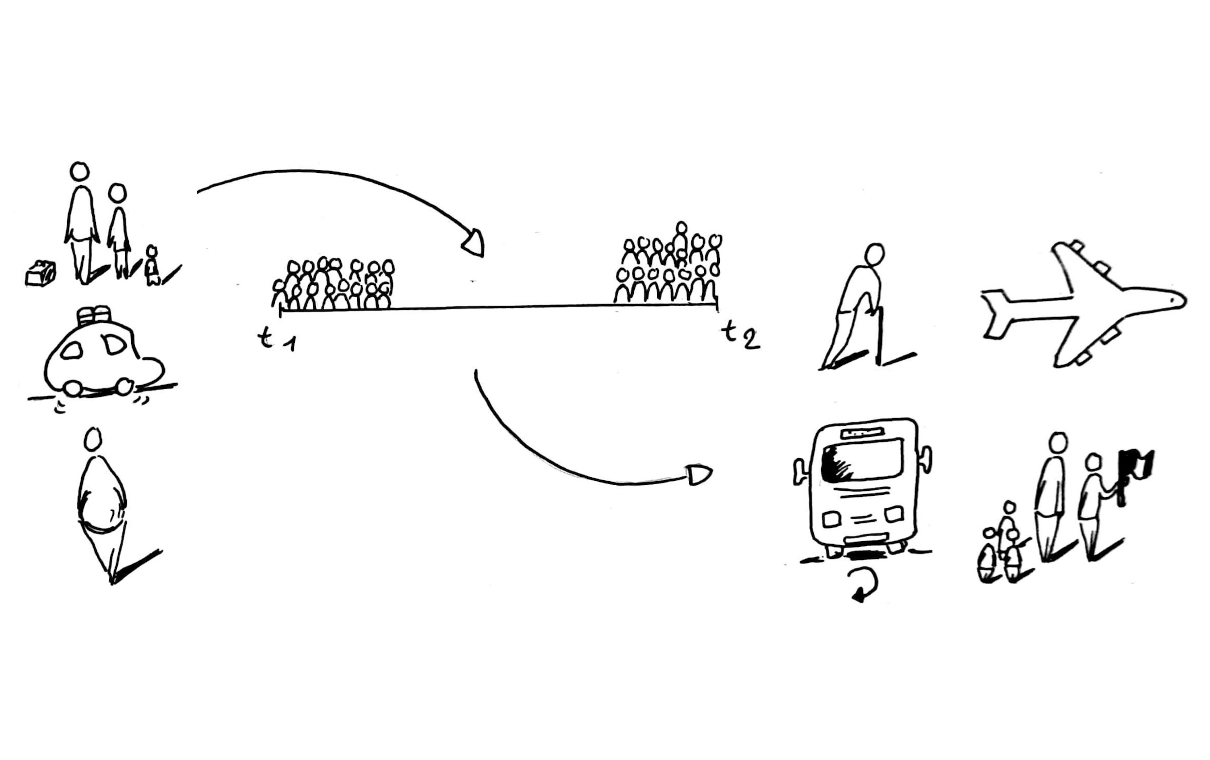
A new dataset recording the number of people forced to flee during each year since 1962.

Five common mistakes when using UNHCR's official population statistics and how to avoid them.
Tips and examples for how to use the application programming interface (API) in UNHCR's Refugee Data Finder.

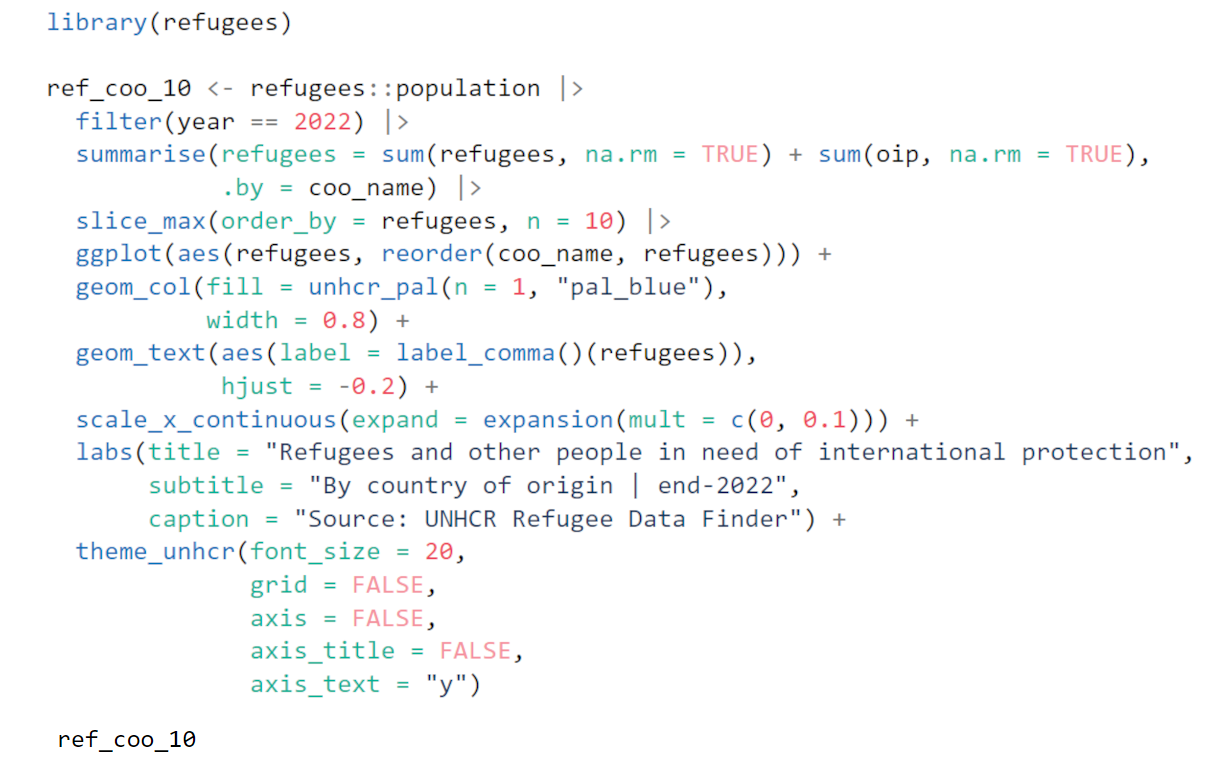
An overview of how to use the refugees r package, including three commonly used vignettes.
Estimates of the number of children born as refugees
by imputing missing birth data between 2018 and 2022.

Visualisations of forcibly displaced population statistics for situations in the
Americas.
